Septemper 3, 2026
An international team of researchers spent six weeks near Cambridge Bay, Nunavut, this spring, collecting detailed measurements of Arctic sea ice to help improve the accuracy of satellite observations.
The field campaign is part of the European Space Agency’s (ESA) Copernicus Missions Sea Ice Experiment and is being undertaken ahead of the launch of three new polar-focused satellite missions designed to monitor changes in the Arctic.
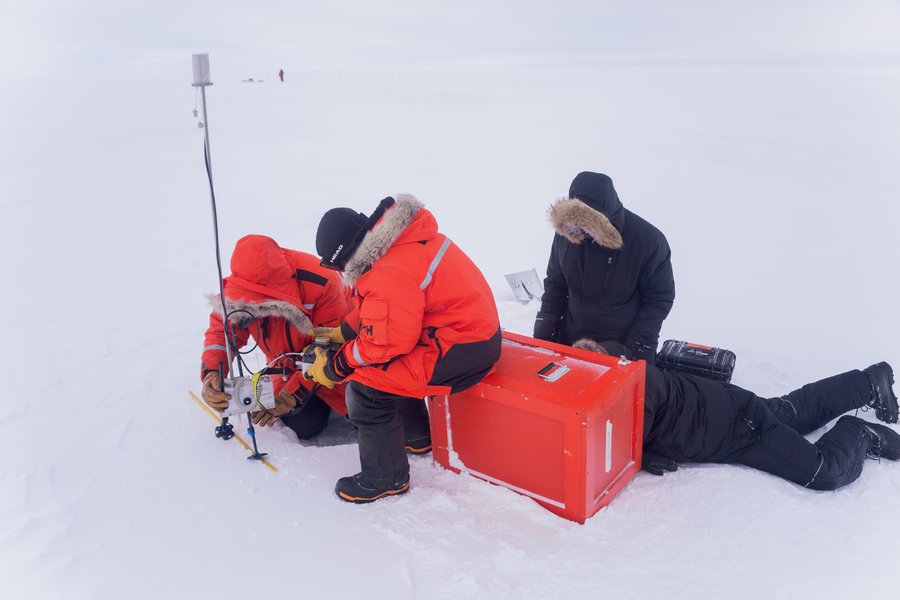
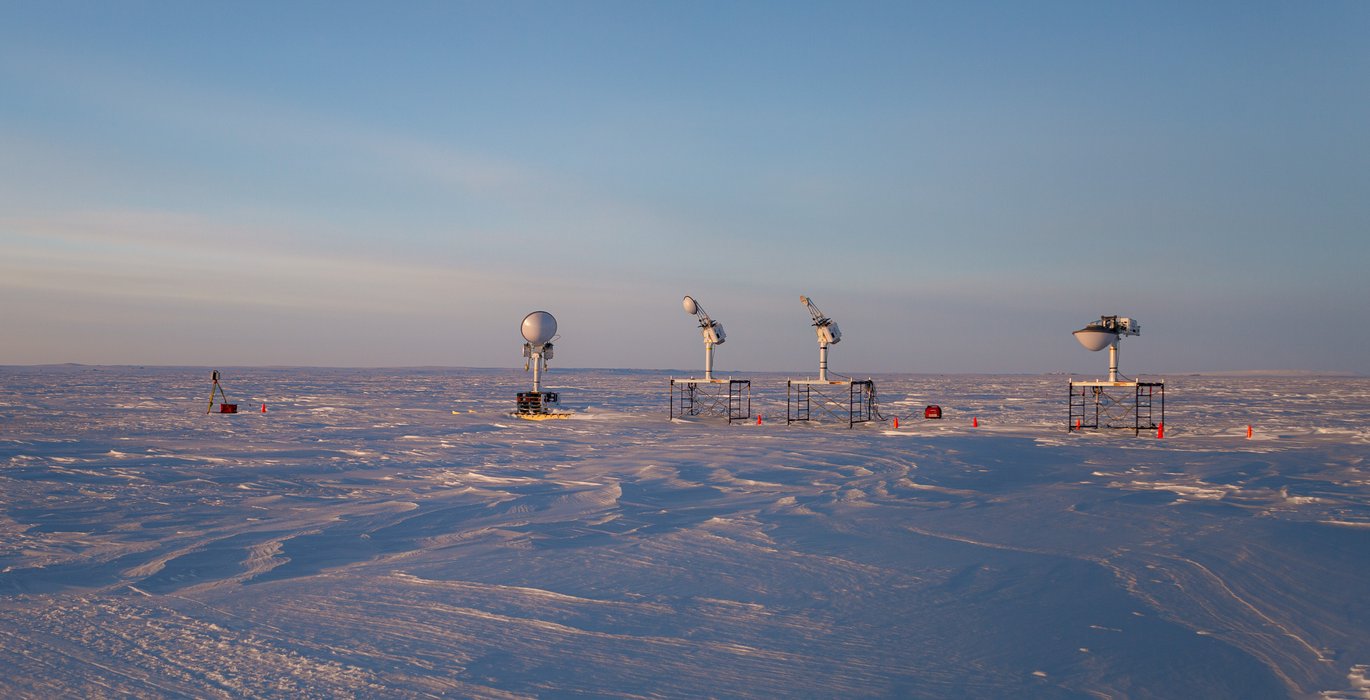
Researchers collecting detailed measurements of Arctic sea ice near Cambridge Bay, Nunavut. (Credit: Clement Soriot/University of Manitoba)
The missions—Copernicus Imaging Microwave Radiometer (CIMR), the Copernicus Polar Ice and Snow Topography Altimeter (CRISTAL), and the Copernicus Radar Observing System for Europe at L-band (ROSE-L)—will study the cryosphere, focusing on sea-ice concentration, sea-surface temperature, polar maritime security, geohazards, polar oceanography, and ice sheets and glaciers, to improve monitoring of Arctic environments and natural resources. Three additional missions make up the rest of the Copernicus Sentinel Expansion program.
Using surveys conducted on foot, by snowmachine, and from aircraft, the researchers compared ground conditions with satellite data. By comparing these data sets, scientists can calibrate satellite sensors, improve data products, and reduce uncertainties in sea ice monitoring.
“You need to actually translate what the satellite sees into a real geophysical variable,” explained Tânia Casal, a physical oceanographer and ESA campaign scientist.
Casal and her team aimed to measure key characteristics of the sea ice, including its location, thickness, type, and duration, as well as other environmental variables.
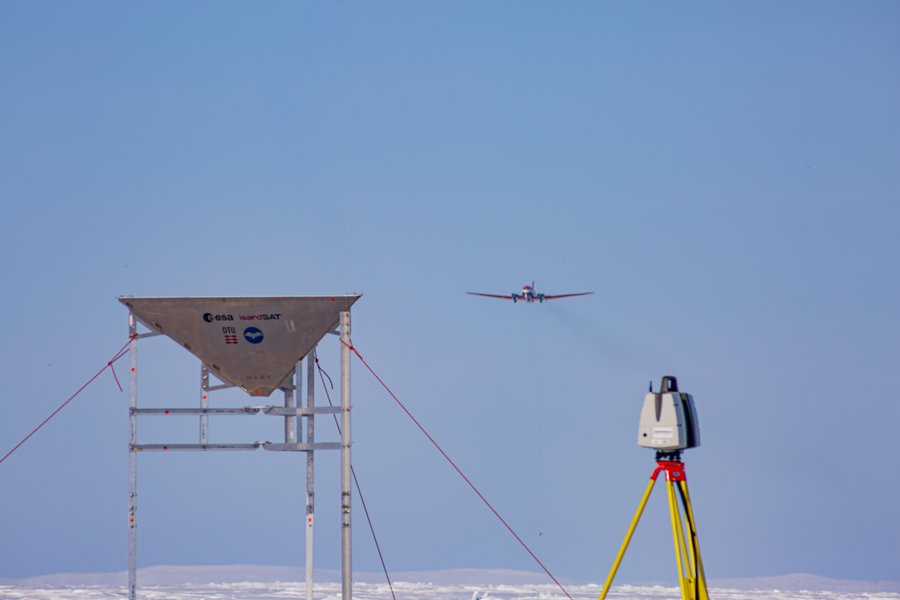
Using surveys conducted on foot, by snowmachine, and from aircraft, the researchers compared ground conditions with satellite data. (Credit: Clement Soriot/University of Manitoba)
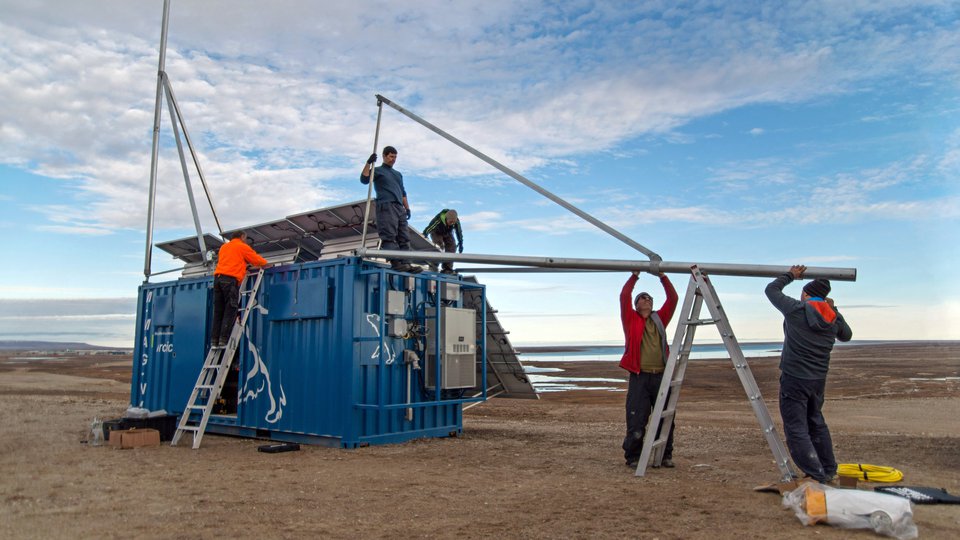
To do this, the ground team selected survey sites, installed scientific instruments, drilled through sea ice, dug snow pits, collected a variety of measurements, and analyzed the data, all while spending long days out in extreme polar conditions.
“Being on the ground with minus 30 degrees Celsius, it is not for everybody,” Casal said.
The campaign’s airborne element used laser and radar altimeters, snow radars, and other instruments to collect detailed information on snow depth, ice thickness, surface roughness, and subsurface structure, which can be challenging to measure accurately from satellites without on-the-ground data.
They worked beneath the tracks of current satellites, including ESA’s CryoSat-2, which launched in 2010, to compare their ground observations and airborne remote sensing with the satellite data.
Behind the weeks of fieldwork were years of planning and international collaboration. Researchers from the University of Calgary, the Technical University of Denmark, the Alfred Wegener Institute, NASA, and ESA came together to design the campaign. They sought to build on the work of the Multidisciplinary drifting Observatory for the Study of Arctic Climate (MOSAiC) Expedition that took place in 2019-2020.
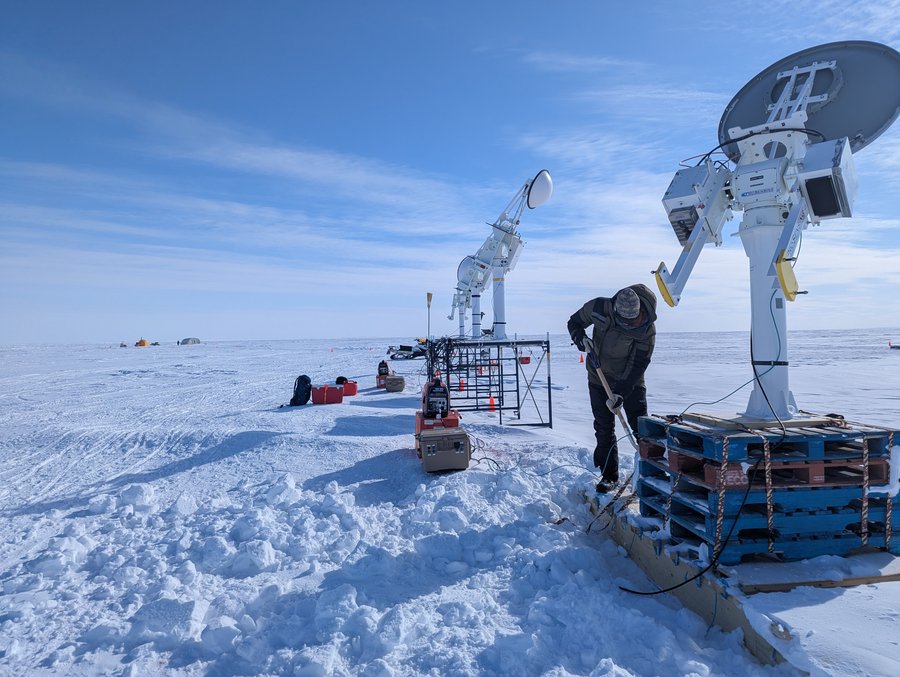
Behind the weeks of fieldwork were years of planning and international collaboration. (Credit: Niel Brubacher/University of Victoria)
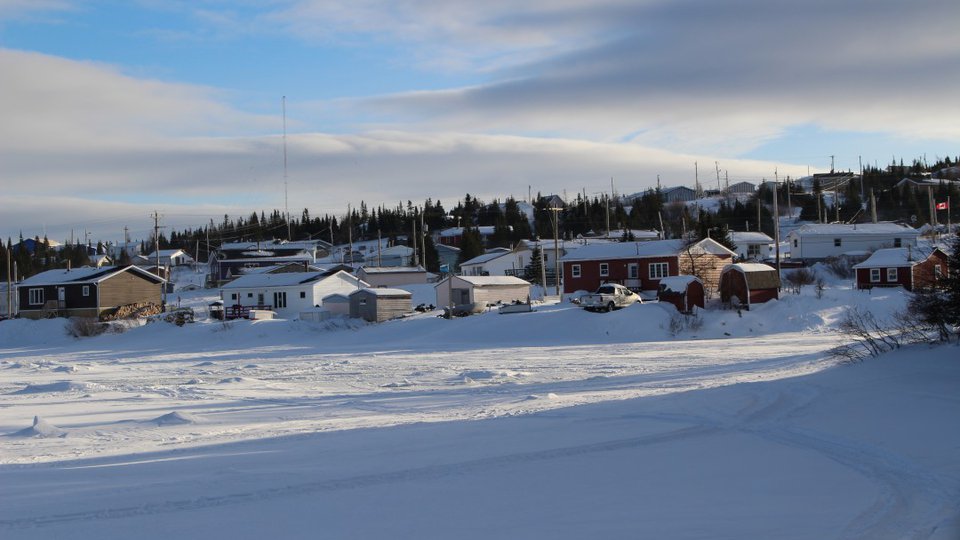
The MOSAiC effort involved freezing the Polarstern icebreaker into an ice floe and obtaining data as the ship drifted through the Arctic along with the floe. The ice they studied then was mostly two or three years old, so for the Copernicus campaign, researchers focused instead on freshly formed sea ice, like the type commonly found near Cambridge Bay. The hamlet is also home to the Canadian High Arctic Research Station (CHARS), which served as a basecamp and provided logistical support for the field team.
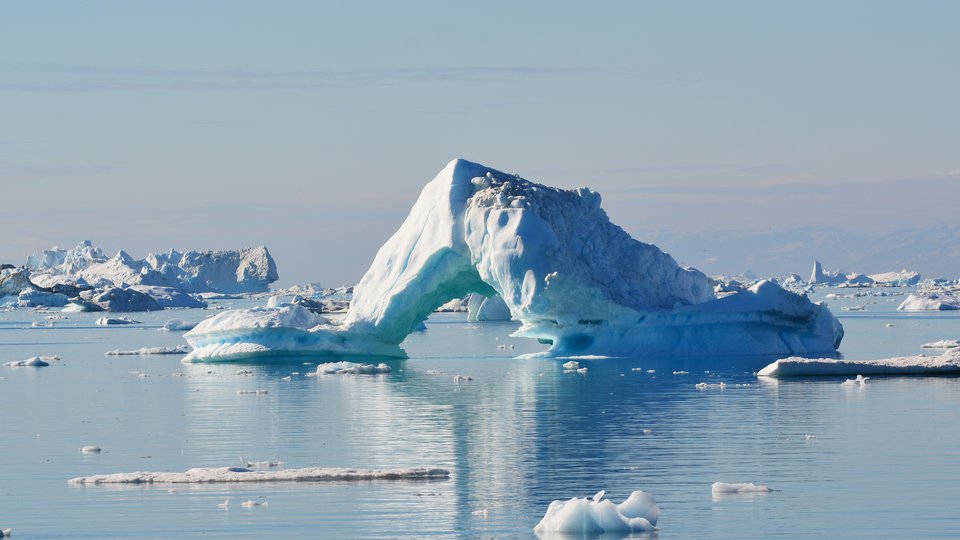
The distinction between first-year sea ice and multi-year ice is important because newly formed first-year ice has much higher salinity than multi-year ice, especially at the base of the snow layer. Scientists want to learn more about this since the ice’s salinity level influences radar signal penetration and microwave scattering. Learning more about the differences in ice and how these variations are perceived by satellites helps the researchers validate data and strengthen their datasets.
Additionally, the ice near Cambridge Bay provided a stable base to work from since it wasn’t drifting, and repeat measurements could be obtained.
“If you want to try to make measurements and compare them in an area where the ice drifts very fast, it's very complicated,” Casal said, explaining that in such situations, researchers who return to the same flight path on consecutive days may end up surveying different ice, which makes it difficult to compare observations over time.
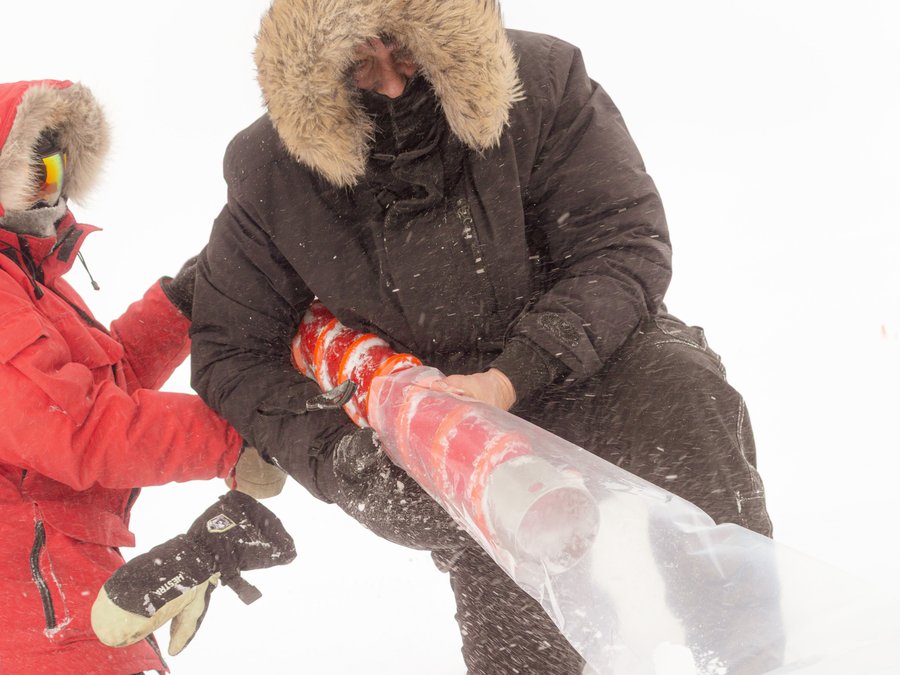
The ice near Cambridge Bay provided a stable base to work from since it wasn’t drifting, and repeat measurements could be obtained. (Credit: Clement Soriot/University of Manitoba)
Collecting on-the-ground measurements also provides information at a finer scale that is not available from satellites. For example, snow depth can vary considerably in a small area, with one spot holding just a couple of centimetres of snow, while a metre away, there could be 30 centimeters.
According to Casal, this variability is one of the major sources of error in satellite measurements. Learning about these ground-level variations helps validate the satellite data, which generally has a coarser resolution than on-the-ground data.
“These campaigns actually are very good in order to really give us the best outcome possible when the satellite is there, so that we are very confident in the data that we obtain,” Casal said.
Refining algorithms and strengthening satellite data are especially timely, with the first of ESA’s satellite launches scheduled to enter orbit as early as 2027.
The data from these satellites will contribute to ongoing long-term efforts to chronicle conditions in the Arctic and to learn more about the changing climate.
Casal added that understanding how Arctic sea ice is changing depends on long-term, consistent observations, noting that researchers now have over 20 years of data showing ice thinning and the loss of multiyear ice.
“This data is crucial to continue this climate record,” she said. “With this, you can start inferring.”
Banner Image Credit: Clement Soriot/University of Manitoba